Padhai Time
Measures of Central Tendency
Once we have finished the step of data collection, now the next step is to analyze the collected data. The first aspect of data analysis is to measure the central tendency. It describes the data in such a way that one center-point can be occupied. Once we know the centrality, we get the basic idea about data.
There are 3 ways of finding the central value:
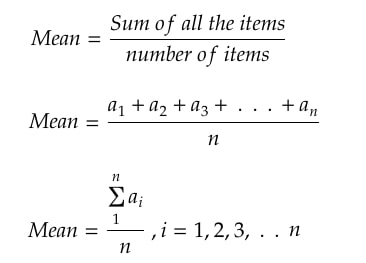
1) Mean:
Mean means average. We apply a basic mathematical formula to get the average value for a dataset.
Suppose in my wallet, I have the currency of various denominations ranging from 10 to 2,000 rupees. Now, I am interested in finding the mean currency value.
Let us write the denominations which are available in my wallet.

Find Mean/average value:
Sum all the denominations = 10 + 10 + 20 + 50 + 50 + 50 + 100 + 200 + 200 + 2000
= 2690
No. of notes available ( n ) = 10
Mean/Average = 2690 / 10 = 269
Meaning in my wallet, the average value of a note is around 269 rupees.
Examples where we can compute mean statistic:
- Mean salary of an organization
- Mean height of basketball player
- Mean temperature during summer Vs. winters
Did you find any technical problems with Mean?
It gets impacted by outliers in data.

As it is clear that we have an average close to 90 only, but due to the outlier “2000”, the mean has got shifted towards right badly (269)
Notes:
- Mean statistic is useful when the data is numeric in nature (discrete or continuous) and it does not contain outliers
- Mean statistic can’t be calculated for nominal or ordinal data
2) Median
As the name suggests, it figures out the middle value in a dataset. There are two formulas to get the middle value depending on the no. of items in the data set.

Procedure:
- Sort data values in ascending order
- Identify the no. of items
- Choose the formula among two of them
- Get the Median

Steps:
- Sorted the currency denominations in ascending order
- No. of items are 10 (even)
- We have to use 2nd formula
- Calculate Median => (5th term + 6th term) / 2 => (50 + 50) / 2 = > 50
Notes:
- It is not impacted by outliers in data
- It can be calculated for discrete, continuous, or ordinal data
- For nominal dataset, it can’t be used
3) Mode:
It tells about the item which is occurring highest in the dataset. An item that has the highest frequency will be the mode.
Procedure:
- Arrange the items in order
- Count the number of elements falling in each category
- A category that has the highest items will be the mode

Currency with 50 Rupees Denomination has the highest count, hence it is the mode.
Notes:
- It is not impacted by outliers
- It can be calculated for Discrete, Continuous, Ordinal, or Nominal data set
- For continuous data, mean or median can be a good metric for finding the central tendency
We collect cookies and may share with 3rd party vendors for analytics, advertising and to enhance your experience. You can read more about our cookie policy by clicking on the 'Learn More' Button. By Clicking 'Accept', you agree to use our cookie technology.
Our Privacy policy can be found by clicking here